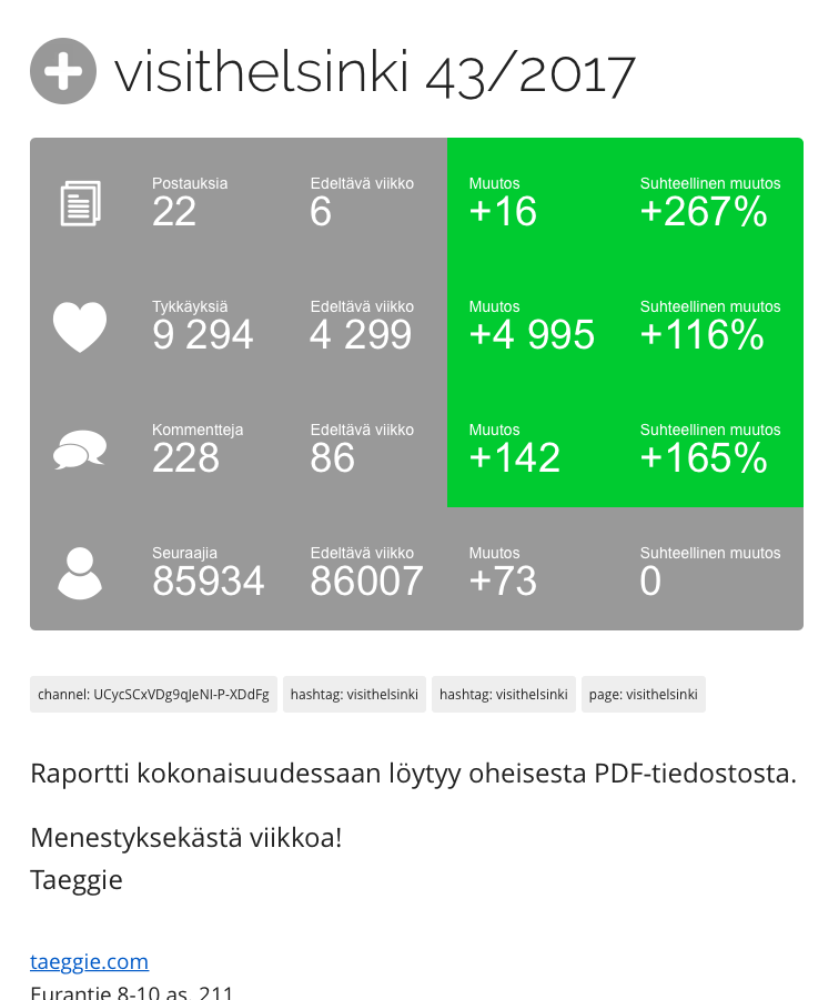
From reports you can easily see which posts have got most likes, comments and shares.
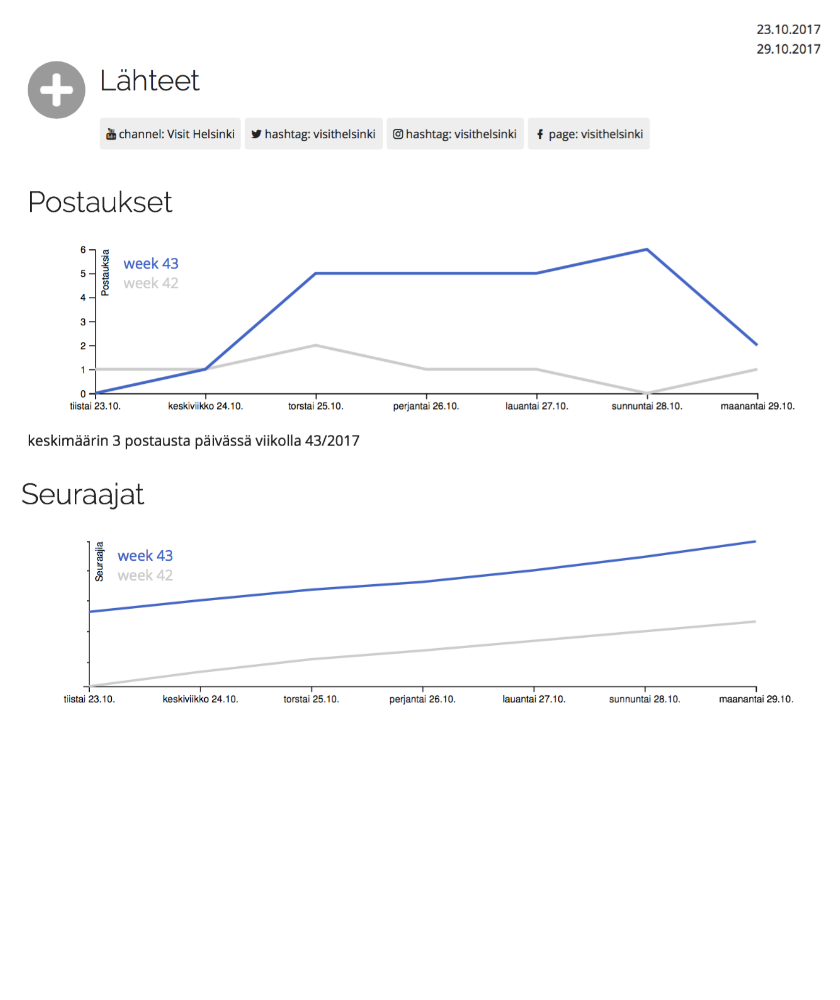
Follow the daily amount of posts and followers using our graphs.
When you see what content works and what does not, you can better develop your content creation.
On top of weekly reports you can make custom reports for any time period you need.
PDF-report lands in your inbox in start of every week.
Reports shows you clearly how the last week has been, and how it compares to the week before it.
You can see how many posts have been made on any given day, and how the follower count has developed during the week.
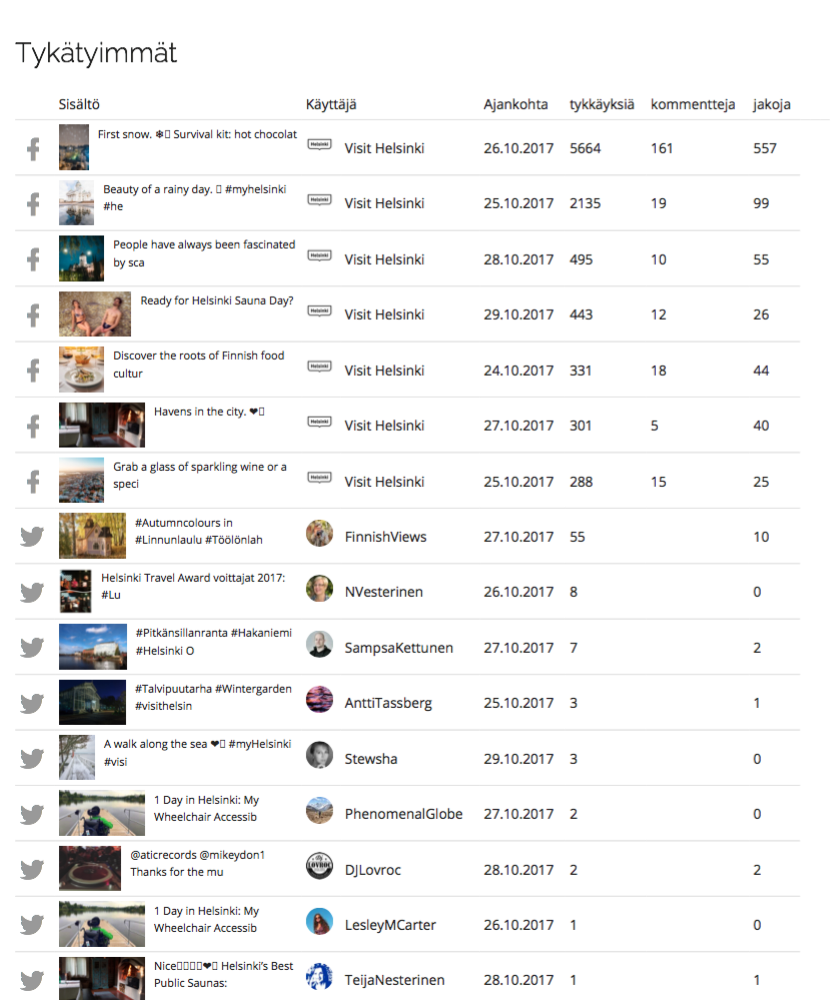
Lists of most and least liked posts help you measure and compare the quality of your content.

Free for first 7 days, cancel at any time. Requires a credit card or a billing address.
If you have an questions, do not hesitate to email us.
You can also acquaint yourself with our product using shared demo account.
Demo account resets every 60 minutes.